Titled “Monte Carlo-Based Optical Simulation of Optical Distribution in Deep Brain Tissues Using Sixteen Optical Sources”, this contribution has been published in the Bioengineering-Basel. In this publication, we conducted a simulation using 16 optical source types within a brain model that is based on the Monte Carlo method. In addition, we propose an evaluation method of the optical propagating depth and resolution, specifically one based on the optical distribution for brain applications.
Congratulations to Xi Yang and to this paper’s co-authors for this innovative achievement.
Reference
Yang, X.; Chai, C.; Zuo, H.; Chen, Y.-H.; Shi, J.; Ma, C.; Sawan, M.; “Monte Carlo-Based Optical Simulation of Optical Distribution in Deep Brain Tissues Using Sixteen Optical Sources”, Bioengineering-Basel 2024, 11, 260. https://doi.org/10.3390/bioengineering11030260
More information can be found at the following link
https://www.mdpi.com/2306-5354/11/3/260
Abstract
Optical-based imaging has improved from early single-location research to further sophisticated imaging in 2D topography and 3D tomography. These techniques have the benefit of high specificity and non-radiative safety for brain detection and therapy. However, their performance is limited by complex tissue structures. To overcome the difficulty in successful brain imaging applications, we conducted a simulation using 16 optical source types within a brain model that is based on the Monte Carlo method. In addition, we propose an evaluation method of the optical propagating depth and resolution, specifically one based on the optical distribution for brain applications. Based on the results, the best optical source types were determined in each layer. The maximum propagating depth and corresponding source were extracted. The optical source propagating field width was acquired in different depths. The maximum and minimum widths, as well as the corresponding source, were determined. This paper provides a reference for evaluating the optical propagating depth and resolution from an optical simulation aspect, and it has the potential to optimize the performance of optical-based techniques.
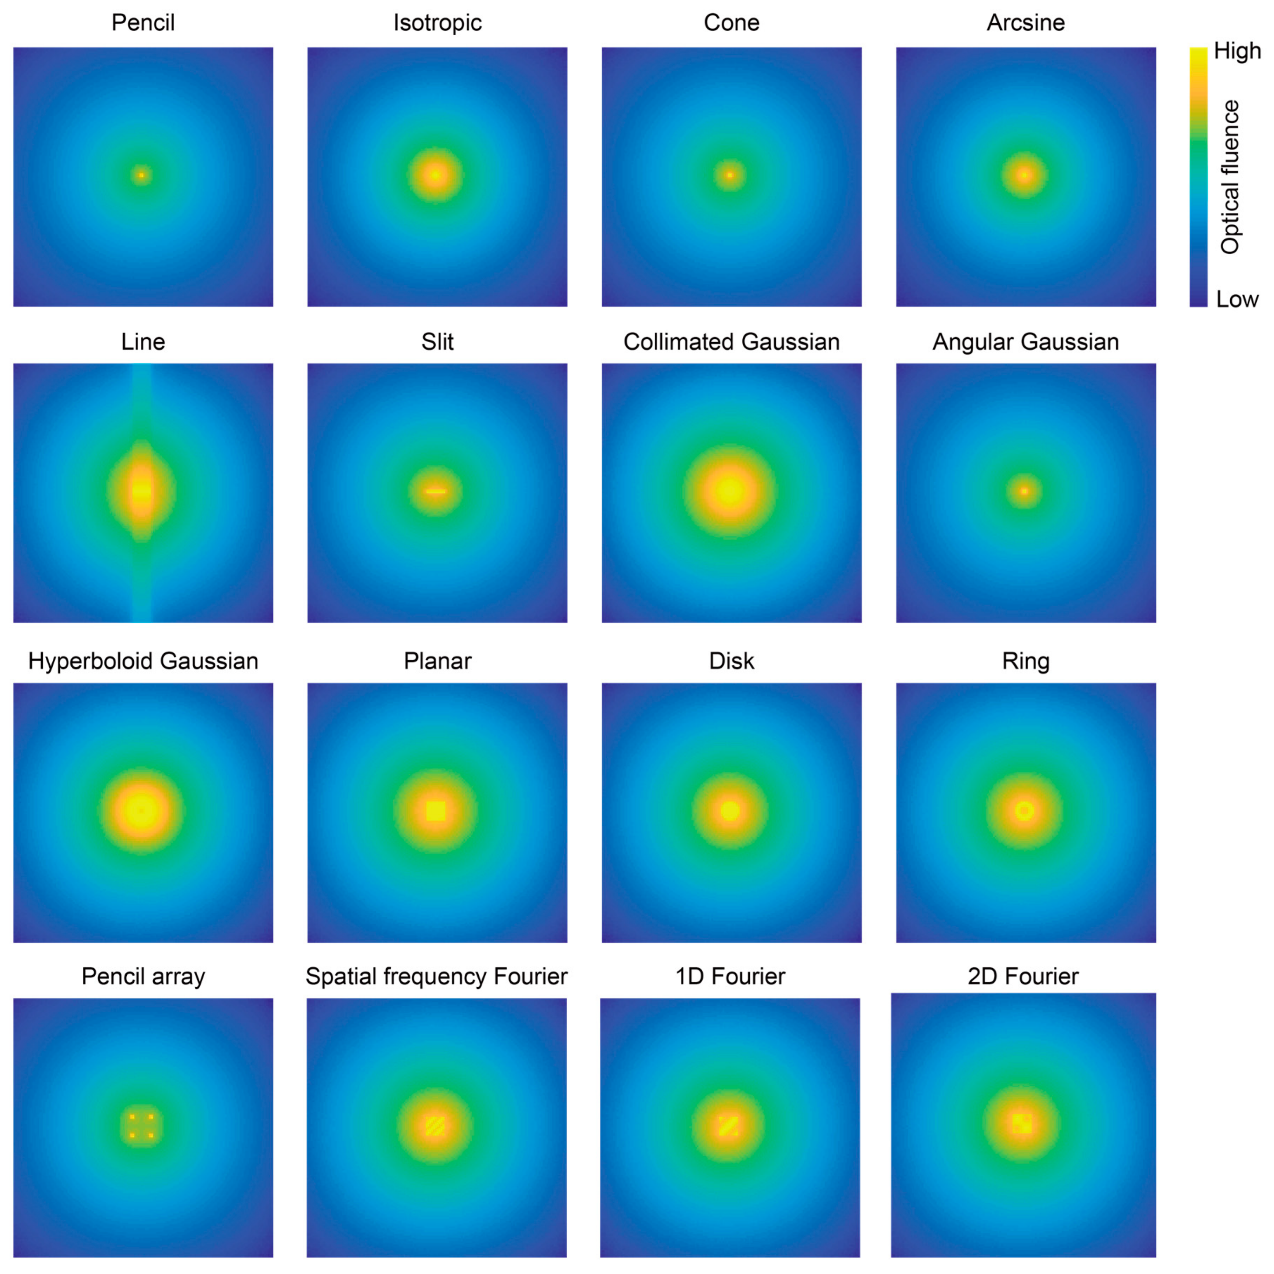
Fig.1: Images of optical fluence distribution of sixteen optical sources at the plane (XY plane at Z = 0.1 mm).
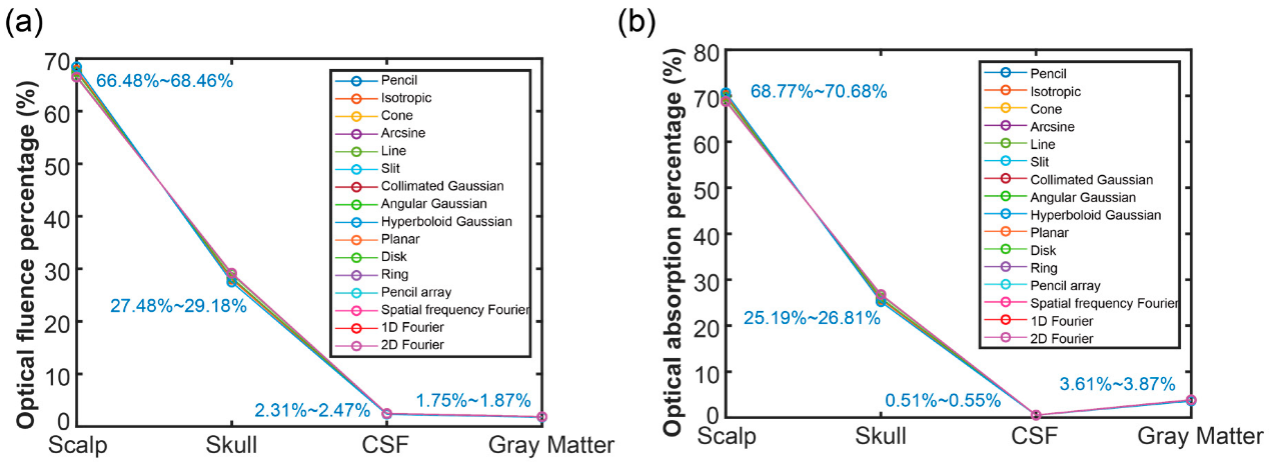
Fig.2: Optical energy percentage in each layer: (a) optical fluence percentage in the four layers, and (b) optical absorption percentage in four layers when using various optical sources.
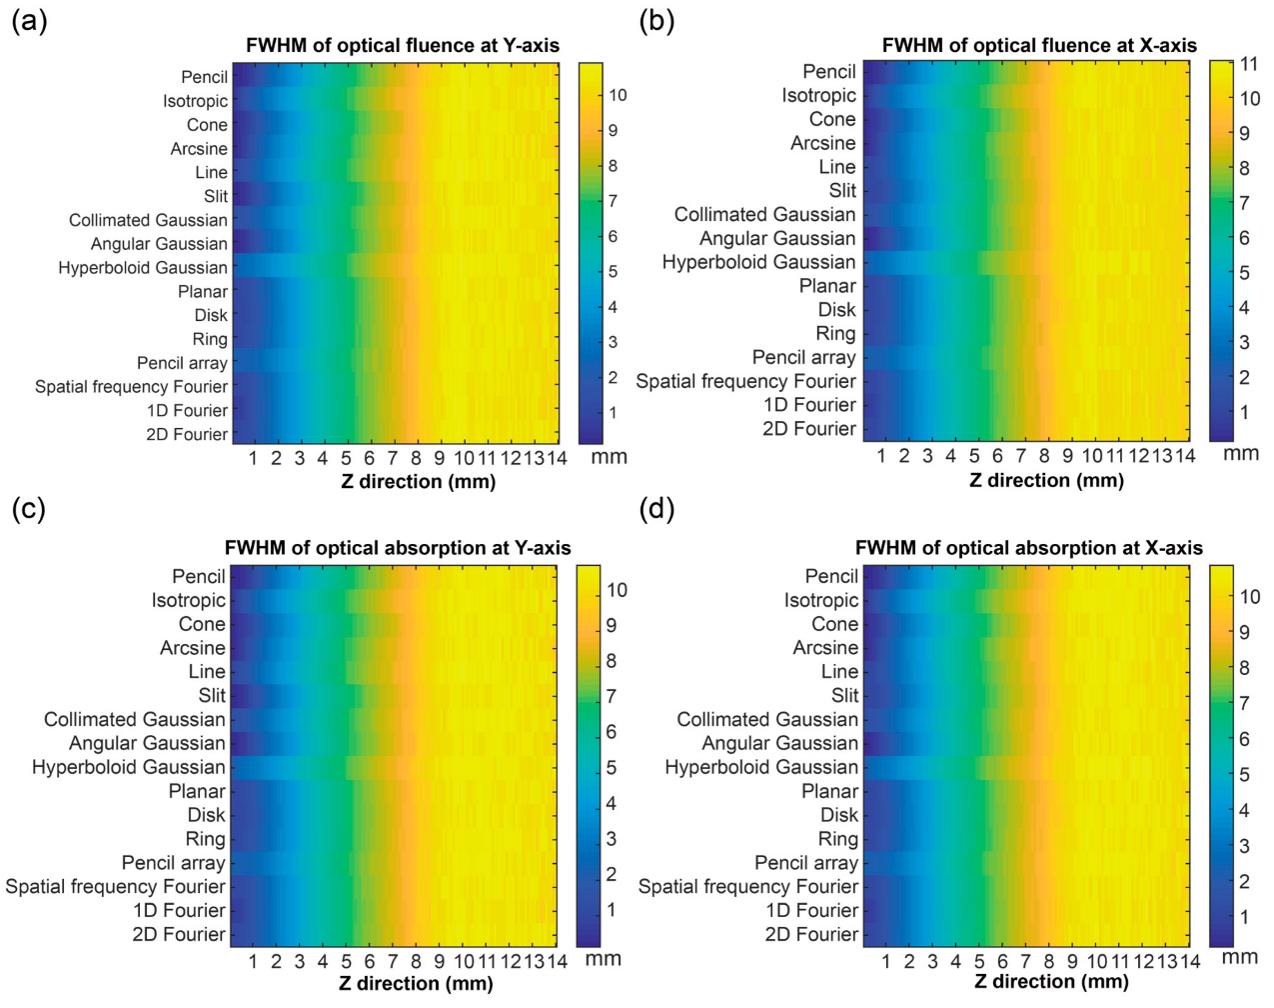
Fig.3: The full width at half maximum (FWHM) of the optical fluence (F) and optical absorption (A) in an X-axis direction and Y-axis direction: the FWHM of the F in (a) a Y-axis direction and (b) an X-axis direction; and the FWHM of the A in (c) a Y-axis direction and (d) an X-axis direction.


